
Events
When resources are blocked due to enforced validation failure actions in Kubernetes clusters, Kyverno policies generate events for them. As an admin, you can view these events for all blocked resources with details such as cluster, namespace, policy name, rule, last seen time, and more. These events enable admins to take necessary actions to unblock resources in clusters.
NOTE:
a) Events are generated only for clusters running Kyverno release version 1.7.0 and later.
b) Events for blocked resources are stored for 7 days.
To view the events for blocked resources:
- Go to Menu>Monitor>Events. The Events page with the details on blocked resources is displayed.
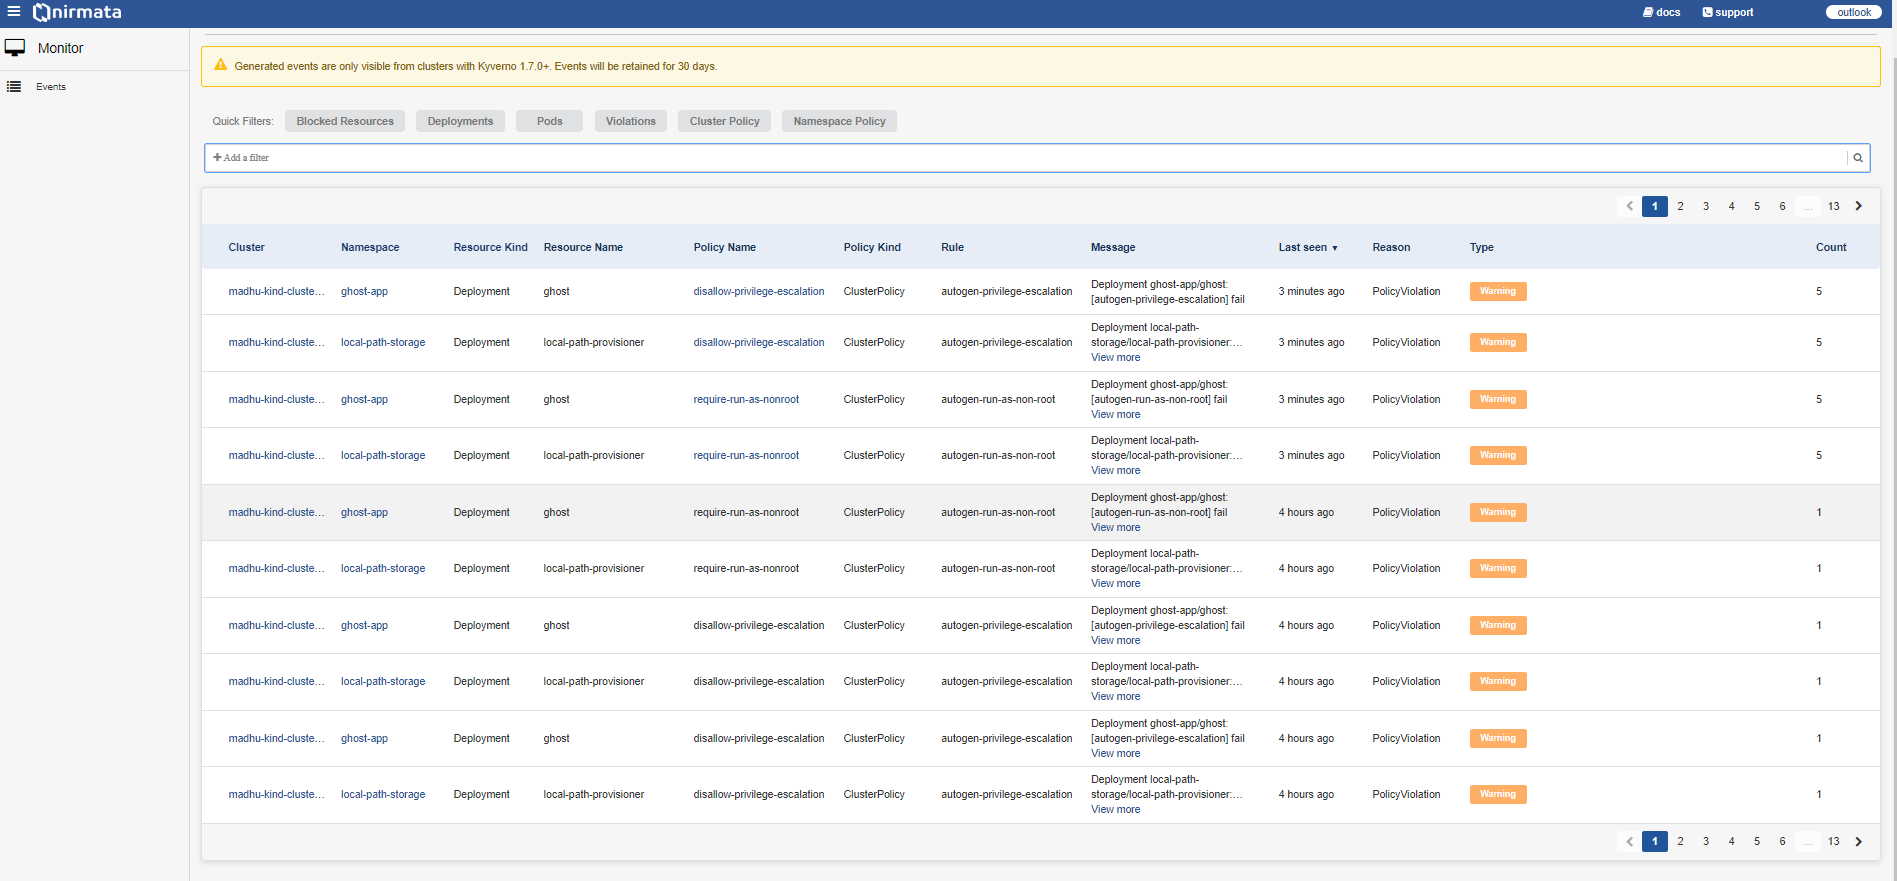
The following table explains what details are displayed in each column:
| Column Name | Description |
|---|---|
| Cluster | Displays the cluster name where the event appears. You can click the cluster name to view cluster details. |
| Namespace | Displays the namespace of the cluster. You can click the namespace link to view namespace details. |
| Resource Kind | The concrete representation of resource type. This is the target object on which the event occurred. |
| Resource Name | The concrete representation of the resource name. This is the target object on which the event occurred. |
| Policy Name | Displays the policy name for which the event was generated. You can click the policy name to view the deployed policy. |
| Policy Kind | Displays the kind of policy for which the event was generated. Values can be: Cluster Policy (Cluster) or Policy (Namespace). |
| Rule | Displays the policy rule for which the event was generated. |
| Message | Displays the path from Cluster to Rule and the associated message. Also displays any errors in the generated events. |
| Last Seen | Displays the timestamp for each event. |
| Reason | Displays the reason for the generated event, for example, policy violation. |
| Type | Displays the type of blocked events such as warning. Color indicators: Yellow - warning messages, Grey - normal messages. |
| Count | Displays the number of times the event was triggered. |
Click on the cluster. The cluster details page is displayed as a sliding window. This page is divided into three sections: Summary, Message, and Resource.
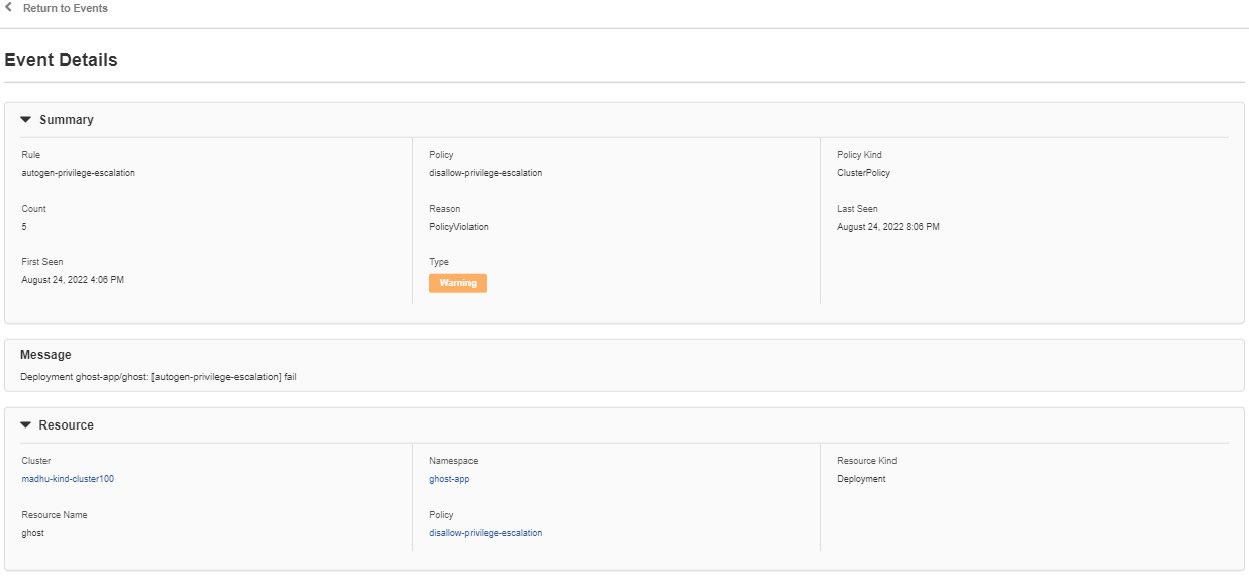
The following table explains the display elements in each section:
Column Name Description Summary Rule This value displays the policy rule on which the event is generated. Count This value displays the number of times the event is triggered. Reason This value displays the reason for the event generated, for example, policy violation. Last Seen This value displays the last seen time stamp for the event. First Seen This value displays the time stamp for the event. Type This value displays the type of blocked events such as warning. The following are the Color indicators in this value: Yellow - indicates warning messages. Grey - Indicates the normal message. Message This value displays the path that is applicable for the events from Cluster to Rule and then the message. It also displays the error on the events generated. Resource Cluster This value displays the cluster name on which the event appears. Namespace This value displays the namespace of the cluster. Resource Kind This value is the concrete representation of resource type. This is the target object on which the event has occurred. Resource Name This value is the concrete representation of the resource name. This is the target object on which the event has occurred. Policy This value displays the policy name on which the event is generated for blocked resources. Go to Quick Filter>Add a Filter to add a filter for events. A list of available filters such as Cluster, Namespace, Resource Kind, Resource Name, Policy Name, Policy Kind, Rule, Message, Reason, and Type will be displayed. Select a filter value (for example: Message), add the keyword (blocked) to filter events, and click Apply. This will display only blocked events. Alternatively, click on filter tabs such as Blocked Resources, Deployments, Pods, Violations, Cluster Policy, and Namespace Policy to see the relevant events.